


Experiment #1: visual interaction combined with visual element
As similar to the initial simulation with LEGO in terms of graphically visualizing the interaction onto the physical object/surface, the...

Thesis Project
Hoon Yoon / Master of Industrial Design(MID) 2016
Rhode Island School of Design(RISD)
Approved by Master's Examination Committee:
Andy Law
Graduate Program Director, RISD, Thesis Advisor
Timothy Maly
Writer, Design Researcher, Lecturer, RISD, Adjunct Thesis Advisor
Jemin Cho
User Interface Analyst, UX Designer, LG CNS, External Thesis Advisor
"P-GUI Sticker" for prototyping the augmented interface within the actual environment in the thesis process
Won the Gold Winner at the concealed category “Advanced Design & Design Research” of A Design Award 2017


The main goal of this experiment-driven thesis is to envision and design an interactive GUI(Graphic User Interface) that coexists with physical surfaces. Based on an understanding of user behavioral patterns for getting access to information in these types of situations, experimentations and prototypes are implemented and tested with participants. In particular, to observe the user behavioral pattern for augmented GUI within certain environments and circumstances, this thesis presents several types of participatory experimentations with physical GUIs. The experiment participants were encouraged to participate in re-creates and reorganizes physical GUI, relating to their own situational specificity or informational tendencies they have.
Based on extracted insights from research and experiments, in the last phase, I propose two thesis models about how interactive GUI applies to a physical environment: simulation mock-ups for user scenarios of augmented GUI and interactive GUI table combined with projection mapping.
Thesis Model 1: Simulative User Scenarios for Augmented GUI
Thesis Model 2: Interactive table reactive to user's haptic motion by projection mapping and pressure sensor
Related to people’s behavioral patterns on augmented GUI, the thesis models will show several types of information structures and interactions. Also, in framing the overall data structure and wireframe for the thesis product model, informative affordance corresponding with users’ situational specificity2 is considered as a crucial direction point, actualized on an artifact in a perceptible way. Through experimentally prototyping a thesis model, consequently, I would like to expand the speculative usability interactive GUI will feature in the near future.
Keywords
Interactive Table, HCI, GUI/UX, Augmented Reality, Affordance, Informative Hierarchy, Projection Mapping, Site Specificity

Fundamentally, the ultimate direction point of the thesis aims to speculatively design the augmented environment integrating with interactive, GUI-embedded artifacts via projection mapping. Based on experimenting the conditions and situations that digitize visual interactions coexisting with daily life, the thesis will experimentally propose the usability for how users interact with augmented information projected on an actual surface within a situational specificity.
To define the user for this thesis project,
• The prospective user group for research and experiment in this thesis is partially limited to those skilled in, or accustomed to using, digital smart devices like smartphones, laptops, tablet PCs, etc.
• In terms of user scenario, most of the thesis experimentations and final outcomes are basically subject to the circumstance of hypothetically interacting with augmented GUIs within a certain situational specificity.
The flow chart below is about the overall sequential procedure for thesis activity as main part of whole thesis.

Figure 1: Sequential flow chart for planning thesis activity.
In research phase, in order to analyze user’s usability pattern on information under situational specificity,
• HCI framework will be utilized as a main methodology in Chapter 1.
• Analyzing the cases of a usability pattern into the form of a consequential algorithm and individual and consolidated sequence models derived from HCI methodology will be utilized.
• Based on data, insights will be clarified, which is relevant to constructing informative structure for designing GUI at the final phase of the thesis.
In the experimental phase, in order to research users’ information propensity under situational specificity, participatory experimentations will be conducted with various types of participants to clarify user insights of informative tendency at a certain situation.
In the prototyping phase:
• Physical GUI stickers will be used in Chapter 2 in order to simulate augmented reality in actual environments.
• In Chapter 3, participants will use a sticker pad to draw their own GUIs and attach what they draw on small-scaled LEGO interior sets representing average living spaces.
• In Chapter 4, participants will use physical GUI stickers, attaching them to a certain spot in their private spaces like residences.
In the prototyping phase:
• Overall, projecting mapping will be utilized as a main tool for actualizing interactive GUI in a physical environment
To conduct visual projection mapping for experimentation, technical tools are suggested as follows:
• Processing will be mainly utilized for actualizing digital interaction and visualization as a way of programming code for it.
• Adobe Photoshop and Adobe After Effects will be utilized in order to prototype the scenario that the augmented GUI interplays with physical environment.
• Based on the codings program from Processing, visual interaction will be projected on the surface via projector.
1. HCI framework on user propensity of informative accessibility
In this research phase, it aims to methodically analyze people’s informative propensity on getting access to information at a certain situational specificity. In order to extract the relational attributes people’s behavioral pattern indicates, HCI framework(Individual Sequence Model, Consolidated Sequence Model) is utilized in clarifying the sequential algorithm of user’s informative tendency.
1) Basic Approach: Tendency of accessing information, depending on situational specificity

Figure 2 : Several venues where we tend to get access to any kinds, any types of information
(Clockwise from Top far left)
1. Searching information with laptop on the table
2. Searching Music on the verge of washing dishes
3. Verifying bathroom sign on the verge of entering there
4. Watching news via smartphone while having lunch
5. Checking out recipe while cooking
6. Trying to check out school's time schedule on the desk, even though it is messed up by scattered clothes and some stuffs
7. Verifying modeling shop's available working hour
8. Watching blog via smartphone while waiting for a subway
2) Analyzing user’s inherent behavioral pattern with HCI methodology
Based on various types of activities of utilizing application via smartphone under situational specificity, I constructed several versions of user’s behavioral sequence model in order to methodically analyze the algorithm of workflow that each events inherently contains.
To introduce with examples, in Figures 3, user behavioral patterns for getting access to applications via smartphones under certain time conditions will be analyzed in a frame of HCI’s Individual Sequence Model. And then, in Figures 4, data will be reorganized and clarified into an activity definition, intention, sequence, and insight keyword in a frame of HCI’s Consolidated Sequence Model.
* The frames of sequence models showing from the following sections
are theoretically cited from the framework introduced in “Sequence
Model Analysis,” “Kim, Jin Woo (2012), Human Computer Interaction 개론
pp 254, 255.” On the basis of HCI frames, user behavioral patterns were
sequentially reorganized and clarified.

Figure 3: Individual Sequence Model for a situation of getting access to a map application under time constraint.

Figure 4: Consolidated Sequence Model for a situation of getting access to a map application under time constraint.
2. Participatory Experiment(1)- Self-directed UI drawing
For practical usability, communicating with actual or expectable users and inherently getting to know about their preference pattern of approaching GUI in daily life are significantly important to comprise of the overall structure and contents within. From this phase I started to think about the possibility that I encourage near people to engage in an experiment as participant and give them a time to manipulate the graphical environment into their own way just as a playful activity. What was the most successful, insights during this participatory experiment was that I was able to acquire their diverse, unexpected, even irrational approach of generating the idea for designing their own GUI on the small scaled-LEGO structure supposed as their living room in the experiment.

Figure 5: Footages of conducting participatory experiment with my classmates and faculties of MID program, RISD
3. Participatory Experiment(2)-Physical GUI Prototyping & Personal preference survey
In designing the overall UI structure which consists of informative structure, speculatively measuring its adaptability of applicating it to the actual environment is crucial for configuring the functionality of what it is showed. In this chapter, to experimentally gauge the usability of UI structure that is anticipated to apply to the physical environment, I attempted to design several types of UI structure which could possibly be utilized in our daily lives, such as, navigating music application while or on the verge of taking a shower, verifying today’s weather forecast, checking the state of food in a refrigerator. In this phase, I contacted with several participants in MID studio, RISD and asked them to play with GUI stickers within their daily lives for approximately a week. Through this experimentation, I intended to see how participants re-organize and re-compose the sample GUIs into their own certain ways, which is deeply reflected on their daily lives and matters.

Figure 6: Scenes of conducting an experiment: Peel off the GUI sticker, do the survey, attach it on the surface where participants feel to do so is a necessity.

Figure 7: A scene of physical GUI prototyping by P-GUI Sticker_a situation of navigating the main page of augmented interface on the transparent window surface

Figure 8: Footages of attaching physical GUI interface sticker(P-GUI Sticker) on the surfaces, based on situational and spatial specificity of accessing to certain information
4. Experimental Assumptions on usability via Projection Mapping
On a situation of perceiving informations from external stimulus comprised of informative-based interactions, people have different tendencies for acquiring it depending on situational, spatial specificities. In order to speculatively see how the graphic-informative interactions are adaptive to the external environment or circumstances, several types of visual projections containing certain contents were simulated as follows.
1) Pilot Demo: Small-Size Simulation via LEGO Interior
Prior to implementing experimentation, as a playful simulation, I utilized the LEGO interior set I used in the previous chapter and projected a simple movable GUI on the LEGO wall to speculate how graphic interaction applied to the physical environment.

Figure 9: Small-scaled graphic interaction projecting on LEGO interior wall.
2) Simulating Augmented GUI in an Actual Environment


Figure 10: Simulation Scenes of various types of augmented GUI that combines with actual environments
5. Prototyping sequential GUI interaction on surface
As an extension for actualizing augmented GUI combining with physical surface, in this stage, I started to develop the concept into designing sequential interaction of GUI. I utilized Adobe’s After Effect for making the sequences of how Graphic motions are occurring and reacting into a certain way by tactile action, like physically tapping the surface. In simulating the prototyping, I deliberately acted as actually navigating application projecting on the surface, in order to recognize the interactivity and affordance application’s GUI contains.

Figure 11: Prototyping video of simulating the augmented GUI integrated with actual environments, in terms of practical usability
6. Developing product model combining with augmented GUI
1) Speculative Rendering
In envisioning how the information is effectively synchronized with physical surface, I figured out the concept of a grid system for organizing and arraying information. Similar to the theory of a Web design’s grid system, in designing an information structure, I thought that utilizing a grid system would enhance the informative unity and consistency for users to understand its relational hierarchy and sequence between each information.
Prior to making an actual product model, I speculatively rendered two different versions of interactive surface-based tables and built rapid mock-ups.

Figure 12: (Direction 1)Honeycomb-shaped interactive surface table in futuristic kitchen place

Figure 13: An initial mock-up for Direction 1

Figure 14: (Direction 2)An interactive surface comprises different shapes, sizes, and heights of grids

Figure 15: An initial mock-up for Direction 2
Concept Critique & Direction Decision
On deciding a direction for designing an interactive surface that suitably interplays with the user, I shared lots of ideas and feedback with thesis advisors and people interested in what I was doing. Particularly for the method of arraying information and constructing information structure, the majority of people I met commented similar opinions. These were that Direction 2’s various forms of grids could rather hinder the user’s attention on information, especially at a certain moment like quickly checking the weather forecast or schedule right before doing something. For perceiving information in real life, they expressed concerns that excessive information via virtual and physical elements happen at one time on the surface. In terms of actual usability, the grid needed to be fixed in a way that was more simplified, and the GUI structure needed to be more clarified and uniformed in order for the user to easily recognize it.
Given advisors and people’s advice, I have come to decide to refine and reinforce Direction 1’s strategy. With maintaining the concept of a honeycomb-shaped grid as a main platform for containing GUIs, clarifying the informative sequence and structure combined with graphic interaction was continuously considered while developing the thesis model.
2) Preparation process for thesis prototyping


Figure 16: A process of making a mock up for prototyping(sensor is yet to be embedded)

Figure 17: A scene of making an initial version of interactive table. To generate reactive graphic interactions on a surface, I concealed pressure sensors under the each grids. This sensor will play a role of reading user’s haptic stimulus and transmitting it to the computer
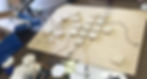
Figure 18: I continuously attached pressure sensors under the wood panel, connected each sensors to an Arduino’s breadboard

Figure 19: This is the moment of simultaneously re-adjusting the coordinate of GUIs while projecting it on a surface. To easily synchronize the graphic interaction with physical grids, I marked the sensor’s position as above by using post-it notes

Figure 20: Footages before conducting small-scaled prototyping experiments with people
3) Designing the interactive surface reactive to haptic gesture
Based on insights extracted from former research and observation, I promoted a small group session for watching the usability of what participants interact with by sensors and movable graphic motion. Basically, the content I created for consisting of the informative structure was a simplified, unmovable weather forecast GUI, yet I intentionally more focused on Graphic motion part, synchronizing with pressure sensors concealed under the hexagonalgrid. Because at the first stage of simulating the synchronizable graphic-motion with haptic action, I thought it would be more relatively crucial to see how
it operates as a first step for developing the reactivegraphic motion-based coding. Through this usability test, I found several types of far-fetched graphic motions and earned valuable user feedback on my initial direction point.


Figure 21: An usability test about interacting with augmented graphic interaction that co-exists with information
4) Expanding the Adaptability of Interactive Surface in an Actual Environment
Similar to the overall direction points of simplifying information, in this exercise, I also intended to map out simplified, pictogram-based information to the surface. Except some contents for notification that requires a bit of detailed information like news or schedules, most of the information is minimalized, and its affordance is clarified by emphasizing symbol texts.
(To explain, in order to make people recognize its functional attributes, I intentionally utilized emphasized, minimalistic typography instead of graphical pictogram icons)

Figure 22: The honeycomb-shaped interactive surface that consists of informative graphics(Time Table, News Feed, Music Icon, Scheduler, etc.)


Figure 23: A footage of conducting small prototyping test at class

Figure 24: Several features of interactive surface by integrating with projection mapping
(Clockwise from Top far left)
1. Virtually Scribbling on the surface
2. Augmented object recognition
3.4. Responsive graphic interaction by haptic gesture on the grid
7. Final Phase: Making an interactive table
Similar to the overall direction points of simplifying information, in this exercise, I also intended to map out simplified, pictogram-based information to the surface. Except some contents for notification that requires a bit of detailed information like news or schedules, most of the information is minimalized, and its affordance is clarified by emphasizing symbol texts.
(To explain, in order to make people recognize its functional attributes, I intentionally utilized emphasized, minimalistic typography instead of graphical pictogram icons)
1) Thesis Show Preparation: Designing whole experience of Thesis Show

Figure 25: A small-scaled thesis artifact model for site configuration of thesis show


Figure 26: Other classmates trying to slightly re-adjust their artifacts' position, which are next to my artifact

Figure 27: A footage of conducting small prototyping test at class
2) Making an actual-sized grid table responsive to haptic gesture
Similar to the overall direction points of simplifying information, in this exercise, I also intended to map out simplified, pictogram-based information to the surface. Except some contents for notification that requires a bit of detailed information like news or schedules, most of the information is minimalized, and its affordance is clarified by emphasizing symbol texts.
(To explain, in order to make people recognize its functional attributes, I intentionally utilized emphasized, minimalistic typography instead of graphical pictogram icons)

Figure 27: A footage of conducting small prototyping test at class


Figure 27: A footage of conducting small prototyping test at class
2) Making an actual-sized grid table responsive to haptic gesture
Figure 27: A footage of conducting small prototyping test at class
2) Making an actual-sized grid table responsive to haptic gesture

Figure 27: A footage of conducting small prototyping test at class


Figure 27: A footage of conducting small prototyping test at class
Figure 27: A footage of conducting small prototyping test at class

Figure 27: A footage of conducting small prototyping test at class
Figure 27: A footage of conducting small prototyping test at class
Figure 27: A footage of conducting small prototyping test at class
3) Making an actual-sized grid table responsive to haptic gesture
Similar to the overall direction points of simplifying information, in this exercise, I also intended to map out simplified, pictogram-based information to the surface. Except some contents for notification that requires a bit of detailed information like news or schedules, most of the information is minimalized, and its affordance is clarified by emphasizing symbol texts.
(To explain, in order to make people recognize its functional attributes, I intentionally utilized emphasized, minimalistic typography instead of graphical pictogram icons)
* Miscellaneous contents of thesis work


